
Looking for the best day & time has been an age old hunt for marketers, dating back to the days of email marketing and cold calling. While efforts have been made to provide this information, whether it’s through articles touting the “best day & time” to post on Twitter based on overall Twitter usage, for example, or trying to get more specific by focusing on an industry, we’ve all come to realize that this magic nugget of information simply doesn’t exist, at least not as an absolute.
While this may be disappointing, there is a way to find more of a guideline for best days and times to post – you may not even be aware it exists, even though it’s free, right at your fingertips, and available to you whenever you need it.
Exported data from your social sites can give you what you’re looking for. While marketers are quite familiar with logging into Facebook, Twitter, and LinkedIn to look at insights, there are export options that can open up a new data set to really look at patterns of content publishing and, even better, your audience’s consumption of it.
What is exported data?
Exported data is simply a raw Excel file that you can generate on the popular social sites. It contains a link to each piece of content you’ve published, as well as statistics on how many likes, comments, shares, retweets, and engagement percentage the content received over time. It’s easy to find and gives you the data needed to look for patterns in audience behavior.
Where do I find this?
It’s fairly simple to find & export your raw data. Follow the quick instructions for each site below:
- Facebook: At the top of the business page, click “insights.” You’ll see the “export” option in the upper right corner on the following page. Use “post data” and standard export.
- Twitter: On the left hand side of the page, choose “more” and then “analytics.” From there, click on “tweets” at the top of the following page, and you’ll see the export button in the upper right corner.
- LinkedIn: On the company page, click on “analytics” and then choose ‘updates’ from the drop down menu. Follow the prompts to export data.
While Instagram allows users to download and export content, it is not like the others in offering analytical data; I imagine this option will be available in the future though.
Each site offers additional export options – spend some time reviewing what data is available beyond the general insights provided by default to see how it may be helpful.
What can I do with it?
Here’s where the fun begins. Each export will contain an overwhelming number of columns; the only columns you’ll need for this purpose are:
URL of content
Snippet of content (if available)
Timestamp
Impressions
Engagement (likes, shares, comments)
% of engagement
The focus for this exercise will be on impressions & engagement by day and timeframe. Excel can make this process easy through the use of COUNTIF and other simple formulas to tabulate the number of tweets, average number of impressions, and average percentage of engagement by day and time bucket. Once you have this information laid out in charts, as they are shown below, you can start to make sense of the data.
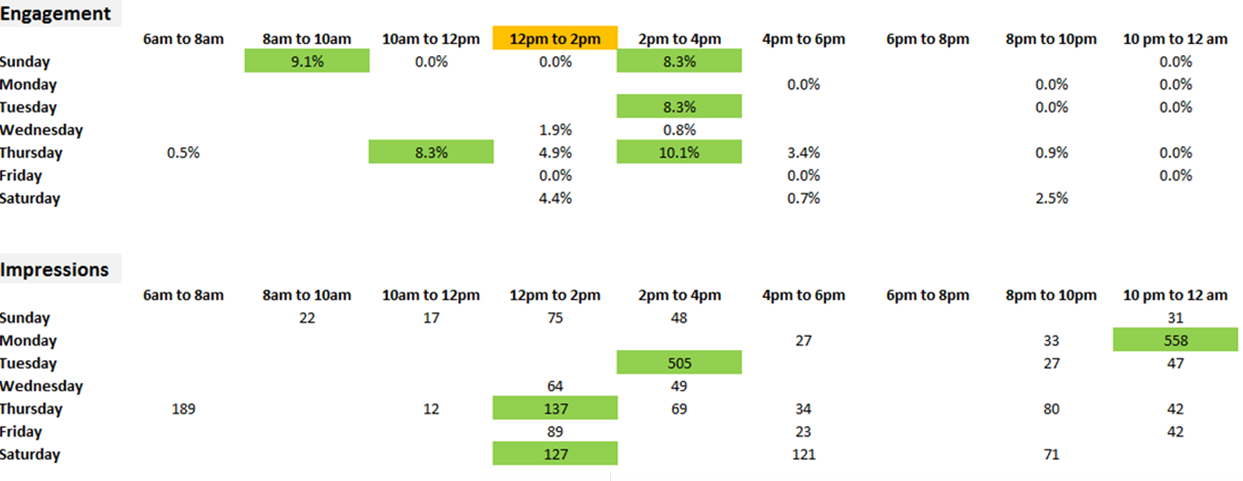
What exactly am I looking for?
What you’re essentially looking for is patterns in higher engagement and impression rates; by creating charts across days and time frames, and highlighting the top days/times for both impressions and engagement, you can start seeing cross over to help determine when your audience is more likely going to see and engage with your published content.
It can also be helpful in looking at your publishing patterns and how that relates to when and how your audience is engaging with it. You may find that the days you’re publishing content most often may not be the best for your purposes.
While this is not the magic bullet we all crave, it can provide some great insights into audience behavior and their social patterns. This is extremely helpful in learning more about how your connections view and engage with your content, as well as providing insight into when they are most likely on each social site. Add this reporting activity to your current schedule so you are monitoring audience behavior and best days/times on a regular basis for maximum impact on your social engagement strategy.
Social marketing is not about us – it’s about our audience, and they are going to tell you what’s working and what’s not working in their behaviors and ways they interact with and see your content. So let them lead the way and learn as much as you can from them to make your life a little easier.
 Author: Marianne Hynd, SMS
Marianne Hynd is the Director of Operations at the Social Media Research Association, a global trade organization dedicated to forming a community of researchers who aim to define & promote best practices and share ideas to help enhance the effectiveness and value of conducting research using social media.
Thank you Marianne for adding some valuable insight to that question. I have seen so many varying opinions, and you nailed it. The data will tell you when your sweet spots are.